Christians tend to be conservative about climate change, but I think probably most now realise that climate change is happening, the world is indeed heating up, and this is causing some serious problems that will only get worse. So this report card on 2015 can be brief.
2015 was the hottest
The US National Oceanic and Atmospheric Administration has released global average temperature figures for last year, and it was significantly hotter than the previous hottest year, 2014.
The graph also shows that the supposed “pause” in rising temperatures (1998-2011) was a slight and temporary slowdown over a generally sharply rising curve. A significant pause was never a reasonable conclusion from the data and was only made plausible by carefully selecting the start and end points. If we look at the larger picture (say since about 1960), the rise is clear, and ongoing. The fifteen years of this century are among the sixteen hottest years on record.
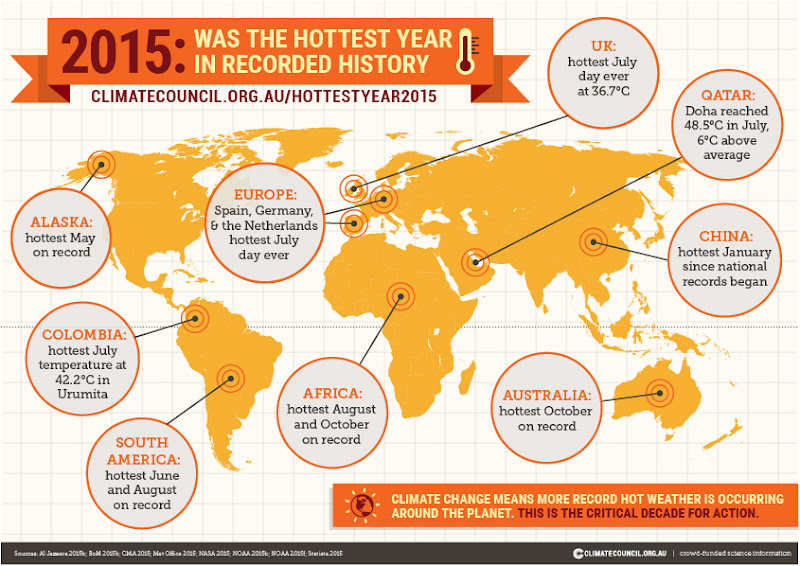
We are living in record hot times. The Australian Climate Council says:
No one aged under 40 has lived in a year with global average temperatures at or below the global 20th century average.
All sorts of temperature records were broken in the past year.
It’s already having a serious effect
Climate change models predict that the world, overall, will get hotter, rainfall patterns will be changed, and extreme weather (storms, droughts, etc) will increase. We are seeing these effects all around the world:
- The World Meteorological Organisation reports many unusual flood and drought events around the world, indicating changing rainfall patterns, with many instances of 24-hour totals exceeding normal monthly averages. At the same time, many parts of the world experienced extended droughts.
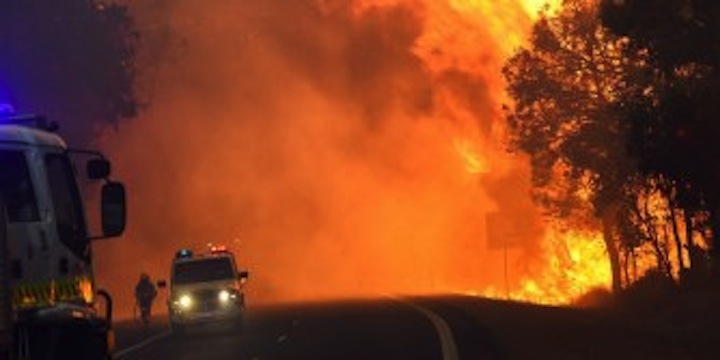
- Bushfires have been a problem in the US and Australia in 2015. Studies show that climate change has increased bushfire frequency and has significantly extended the Australian fire season. (Similar effects have been calculated around the world. For example, Alaska experienced almost double the normal number of bushfires and double the area of land burnt out in 2015.)
- There has been an increase in hurricane activity and severity. Hurricane Patricia, in October 2015, was the most powerful (measured by wind speed) hurricane ever recorded in the western hemisphere.
- The US has experienced an unusually mild (warmer) Christmas, but parts of the US experienced record and damaging snow storms.
- Australia’s Great Barrier Reef is the world’s largest coral reef (in fact, it is the largest living thing on earth), but over the last 40 years has begun to experience bleaching events caused by raised water temperatures. These events have been a major cause of a decline in coral cover, down to half what it used to be.
There are some positive signs
The cost of renewable energy has decreased significantly in the past decade, and the renewable energy sector is growing – almost 5 million new jobs in 6 years, as many countries and cities dramatically increase their commitment to renewable energy. Unfortunately, Australia reduced its commitment to renewable energy in the past few years, although a change of leadership may reverse that (we hope!).
But there is still a long way to go.
Support the necessary change
It is difficult to argue with the data, but there is still some misinformation and dodgy statistics around. It would be helpful if christians could avoid being gullible and consider the data. God has made us stewards of the earth, and surely we want to care for it.
We can support constructive change (greater use of renewable energy and phasing out the use of fossil fuels), though our votes and our purchases. We can choose whether christians are seen as being part of the problem or part of the solution.
Picture: Climate Council.
Ah, your assumption is wrong. The data used to construct the first chart is showing global temperature since 1900 is suspect. Using hovering satellite data gives us another picture. I would take this opportunity to point out that once again the overwhelming factor, the Solar cycle and the sun’s activity is not taken into account at all. We are actually headed for a Maunder Minimum, which will be characterized by very diminished solar activity, solar flares, sunspots etc, the last time there was a Maunder Minimum we had a mini-ice age
Hi Anonymous, what you say is interesting. Do you mind if I ask you a few questions please?
1. What is wrong with the data I used? Can you explain how “hovering satellite data” gives another picture, and what that picture is?
2. What information do you have that sun activity isn’t taken into account in the models?
3. You say we are “actually” headed for another “Maunder minimum”. On what is that prediction based, and how certain is it compared to the climate models?
Thanks.
I’m not going to enter the argument as I’m not qualified , but both of you may find this article interesting:
http://www.space.com/19280-solar-activity-earth-climate.html
I found the following article interesting
http://www.space.com/19280-solar-activity-earth-climate.html
Hi, thanks for that, it is an interesting article. I will refer to it again, later.
I’m sorry you are still getting moderated, and hence unsure if your comment has been accepted. I don’t know why that is happening, as I can’t see any reason for it. WordPress mustn’t like you for some reason! 🙁
Yeah well, the story of my life !
🙂
That’s the reason for my multiple post, I wasn’t sure if the first one got lost.
Cheers.